There are many monitoring solutions available in the market. Some of them are ubiquitous and very popular. However, all of them are simply wrong and put the burden of monitoring on the users. They still use the approach that worked well when we didn’t have multi-tenant applications and hundreds of microservices but is not good enough today. In this article, we’re going to see what these solutions lack and what modern monitoring should look like.
There are many aspects of why our current monitoring solutions are not enough. Let’s go through them one by one. We’re going to see examples from today’s biggest players in monitoring like Datadog, New Relic, AppDynamics, or Dynatrace. We’re going to see where they’re wrong and misleading.
Generic Metrics
Monitoring systems focus on raw and generic metrics because they are easy to obtain. These metrics are anything that can be generalized across systems and applications. For instance, we can always measure the CPU usage of the application or how much memory it consumes. Doesn’t matter if the application is CPU-intensive or memory-intensive, we can always get these metrics. The same for networking, the number of files opened, the number of CPUs used, or the running time.
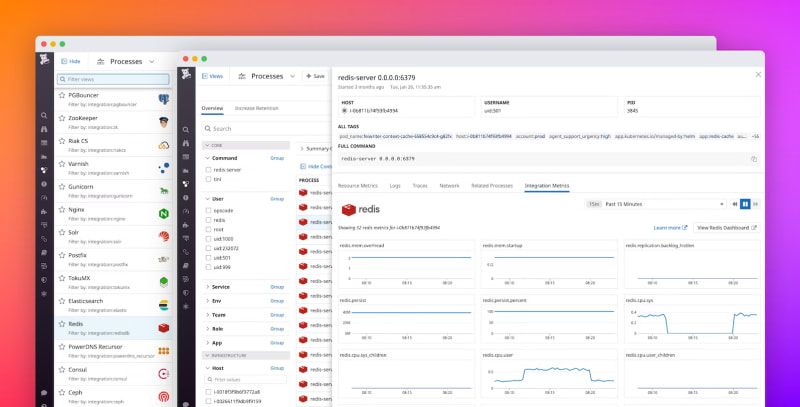
Presenting these metrics is also easy. We can just plot charts showing how metrics change over time. For instance, below is an example of a Datadog dashboard that shows generic metrics.
The problem with these metrics is that they are general and do not tell us much. Okay, maybe the CPU spiked. So what? Or maybe the application uses a lot of memory. Is that a problem? We can’t answer that easily without understanding the application. Let’s see why.
Memory consumption is a great example of a metric that we can always capture but can’t easily understand. There are many types of memory. There is native memory, there can be managed memory (in JVM or .NET, or any other managed runtime), there can be resources (like graphics or videos) and data structures, the application may use eager garbage collection or a lazy one, there can be many different GC algorithms, and so on. We typically don’t focus on the memory usage in our applications and we let automated GC to deal with it.
Let’s now take a situation in which the server has tons of free memory and we didn’t need to run the garbage collection. The memory consumption metric may be steadily increasing. Is this a problem? That depends. If the memory can be released (and will be released when we call the GC), then it’s not a problem at all. However, if we can’t release the memory for some reason, then it becomes a problem. Another aspect is what type of memory we consume. If we’re running a Java application and we see an increase in the managed memory, then it’s perfectly fine. However, if we see the native memory going up and the managed memory staying flat, then it may be an issue.
It’s easy to capture metrics. It’s hard to understand if these metrics are useful.
Recommended reading: Database Monitoring Metrics: Key Indicators for Performance Analysis
Too Many Metrics
Another aspect is how many metrics to collect and how to group them. It’s not enough to “just track the CPU usage”. We need to group the metrics based on the node type, application, country, or any other dimension.
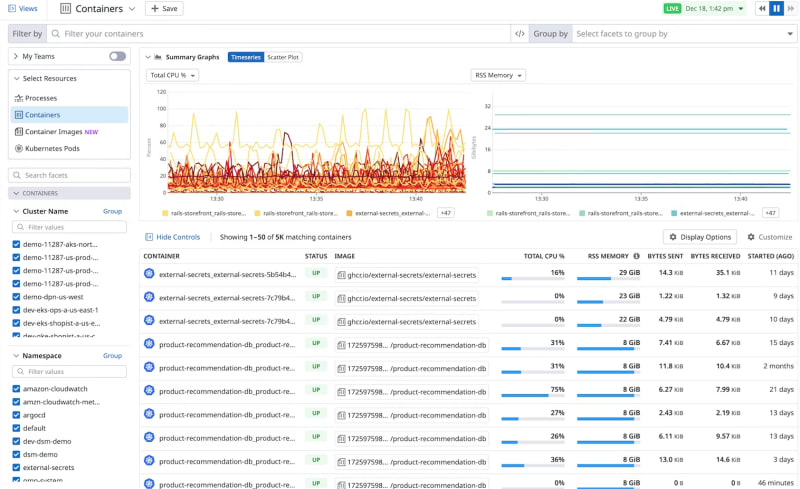
However, this is where the problems begin. If we aggregate metrics under one umbrella “CPU”, then we won’t see severe issues affecting only a subset of the metric sources. Let’s say that you have 100 hosts and only one of them hogs the CPU. You won’t be able to see that when you aggregate the metrics. Yes, you can come up with p99 or tm99 metrics instead of an average, but that doesn’t help either. What if each single host gets a CPU spike one after another? Your metrics won’t be able to find that out. See this Datadog example:
Once we realize that, we may try capturing more and more dimensions, building more and more dashboards for different dimension subsets, and then setting thresholds and alarms separately. This is when we have just too many metrics. For instance, this is how you can end up in Datadog browsing through metrics:
It’s easy to capture metrics. It’s hard to make metrics capture issues.
Manual Understanding
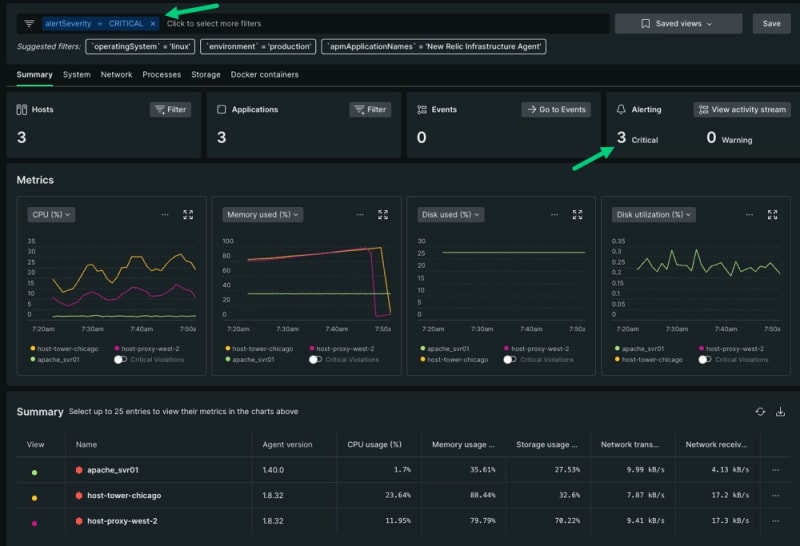
The next issue around monitoring solutions is that they don’t provide answers. They can easily show there are errors and issues based on some generic heuristics or thresholds, but they don’t give the full story. For instance, here is a dashboard from New Relic:
The dashboard looks clean and tidy. We can immediately see there are alerts. But what’s the reason for that? What’s causing memory drops, CPU hogs, or other metric anomalies?
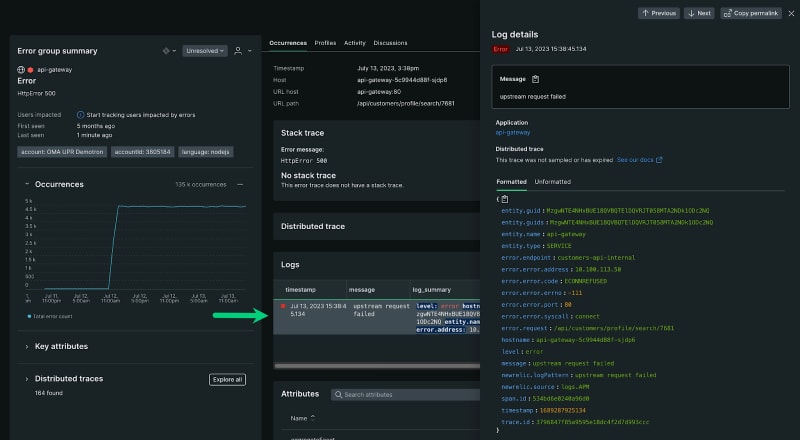
New Relic requires users to manually understand what’s wrong and where the issues are. They make it straightforward in their documentation: Because you spent time upfront narrowing down the service closest to the failure and choosing the likely error group, you have time to read your logs.
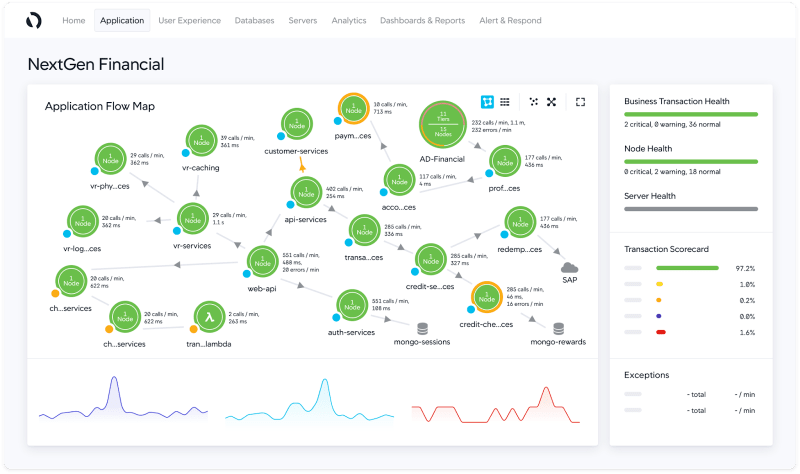
While this sounds easy, this is not what we should be doing. Similarly, AppDynamics measures business transaction health across relevant microservices and containers but doesn’t explain how the unhealthy nodes affect each other.
These tools make us spend our time working on debugging the problems instead of adding more features to our applications. They do it because they can’t analyze problems automatically but they only give us “everything we need” to do it on our own. That’s simply a waste of our time.
Recommended reading: What Is Database Monitoring & Why You Need It
Metrics Instead Of Understanding
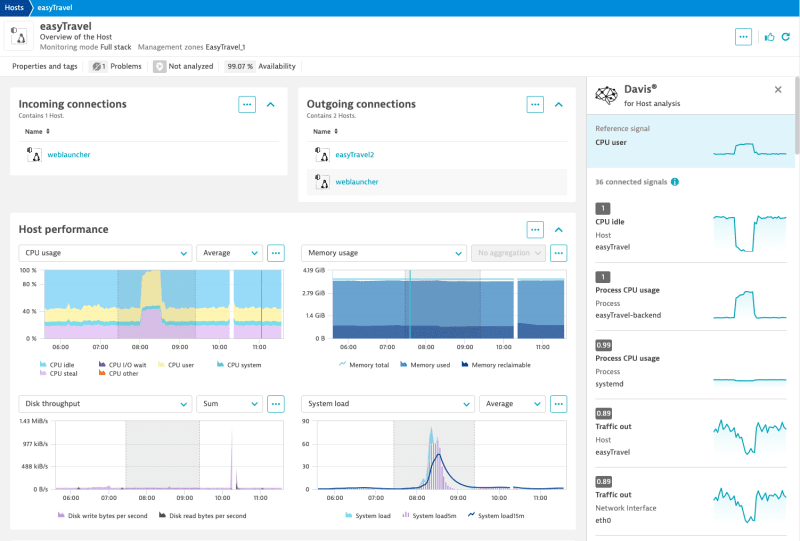
Yet another issue is overfocusing on metrics instead of the problems. Monitoring systems can be even quite smart around making “metric anomalies” the main problem we need to focus on. For instance, Dynatrace’s Davis uses AI to quickly find and explore time series with similar behavior to the one you’re investigating.
The problem is that it’s not metrics that we’re interested in. We’re interested in our application, business cases, and the actual reason for the issues. Sure, having metrics around can be helpful but it’s not what we’re after.
We explored some of the problems the biggest players face today. Let’s see solutions and how Metis stays ahead.
Automated Solutions
We need to have automated solutions explaining what happened, why, and how to fix that. Solutions that focus on the actual root causes and not on the metrics.
Metis integrates pieces of information from many sources, including CI/CD pipelines, local developer environments, pre-production stages, and production databases. Metis understands both infrastructure and database signals. Finally, Metis can project behavior from one environment onto another to understand whether things will work well everywhere. This can be used in many ways:
You run a query in your local database. Since you have only 100 rows locally, your query is fast. Metis can project this query onto the production database (without executing it there) and understand that the query will be too slow in production as there are millions of rows there and the query doesn’t use any index
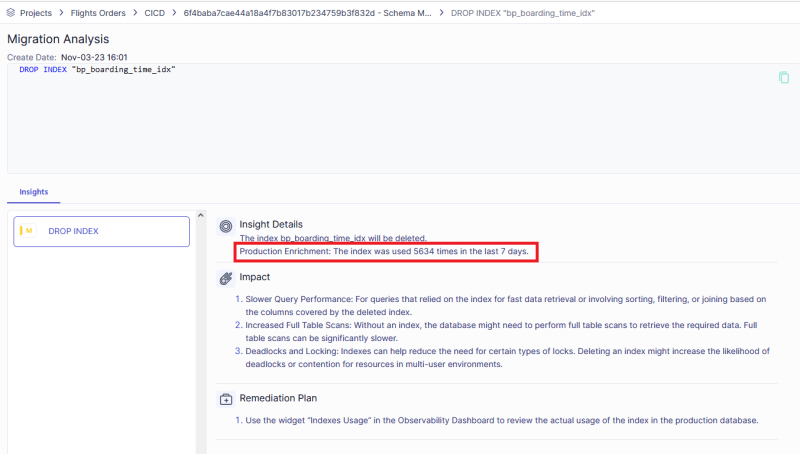
You drop an index as part of schema migration. Metis can identify that this index has been used in the last days in some of the replicas of the database and can warn you that dropping the index is dangerous
You configure an index to improve query performance. Metis can verify this index against other databases and recognize that the index won’t be used as the database engine doesn’t consider it helpful. You don’t even need to run load tests to verify the performance as Metis can guide you immediately
Those are only some of the examples of what we want. These analyses must be fully automated and executed across all our systems. We can’t spend time browsing through metrics manually or waiting for load tests to complete. We need to push these analyses early to the left to have short feedback loops and actionable insights.
Recommended reading: Observability vs Monitoring: Key Differences & How They Pair
Understanding
We need our systems to provide an understanding of what happened and why. Currently, systems provide facts and we are supposed to reason and build a coherent story. However, this must be changed.
A fact is something that happened. CPU spike is a fact. CPU spike is not understanding. Memory usage is a fact. Memory usage is not understanding. Monitoring solutions are great at capturing and presenting facts in many different ways. However, they don’t build understanding.
We need coherent stories explaining what happened. Not something like “your CPU spiked” but something like “you deployed the changes three days ago; today is prime time in one of the countries; we received many more requests around this particular data; the index is not used; CPU spiked because the database needs to work harder to handle requests; add this index to fix the issue”. This is what we need from our tools.
Metis does that by analyzing data from various sources, projecting them on production, and testing various hypotheses. Metis can check various solutions automatically and see if they actually help. Then, Metis can suggest how to apply changes to fix the issues right away.
Recommended reading: How To Prevent Developers From Breaking Production with Metis
Automated Learning
Last but not least, the tools should learn automatically. We need solutions that can reason about the thresholds and alarms automatically based on what they see. We shouldn’t set thresholds manually and spend time figuring out how to tune our alarms for particular countries or metric dimensions.
Metis solves that by running anomaly detection on all the signals. Once Metis captures the data, it can then look for patterns and typical changes in the metrics. It can then understand whether observed changes are acceptable or if they are outliers.
Next, Metis can also understand how metrics should change. Since Metis tracks everything in CI/CD and understands what changes are deployed to the system, Metis can immediately detect drifts. This way we can focus on running our business and Metis can take care of keeping it in shape.
Modern monitoring solutions are wrong. They overfocus on metrics, capture too many generic signals, and don’t provide any understanding. They put the burden of monitoring on the user and only help with presenting the signals in a nice way. This is not how we should move forward.
Metis fixes this by automating reasoning and providing actual solutions. Metis understands moving parts from all the areas of the software development lifecycle. Metis captures CI/CD, schema migrations, infrastructure metrics, database-focused signals, and manual changes performed against databases. Metis then can provide solutions and build coherent explanations. Finally, Metis can learn automatically and verify hypotheses without user intervention. That’s exactly what we need to focus on the business and make our applications shine.

