Problem description
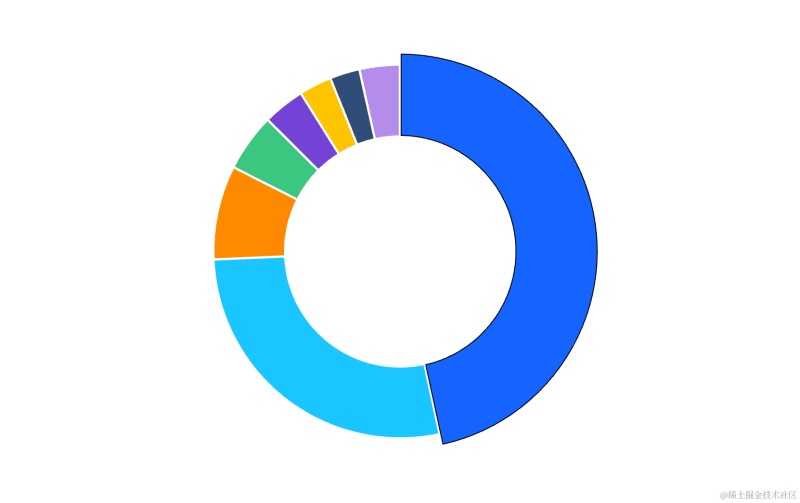
When drawing a pie chart for the first time, I hope to highlight a block. How should I configure it?
Solution
- First, you need to set the graphic style in the selected state in the chart spec configuration.
pie: { state: { selected: { outerRadius: 0.85, stroke: '#000', lineWidth: 1 } } },
- Set the default selected data item through setSelected API
const vchart = new VChart(spec, { dom });
vchart.renderSync();
vchart.setSelected({ // one data record
})
Code example
const spec = { type: 'pie', data: [ { id: 'id0', values: [ { type: 'oxygen', value: '46.60' }, { type: 'silicon', value: '27.72' }, { type: 'aluminum', value: '8.13' }, { type: 'iron', value: '5' }, { type: 'calcium', value: '3.63' }, { type: 'sodium', value: '2.83' }, { type: 'potassium', value: '2.59' }, { type: 'others', value: '3.5' } ] } ], outerRadius: 0.8, innerRadius: 0.5, padAngle: 0.6, valueField: 'value', categoryField: 'type', pie: { state: { selected: { outerRadius: 0.85, stroke: '#000', lineWidth: 1 } } }, }; const vchart = new VChart(spec, { dom: CONTAINER_ID });
vchart.renderSync(); vchart.setSelected({ type: 'oxygen'}) // Just for the convenience of console debugging, DO NOT COPY!
window['vchart'] = vchart;
Results show
Related Documents
Discover more from Coursity
Subscribe to get the latest posts sent to your email.


